Engineering 44 Fall 2017

Tuesday, September 12, 2017

9/12/17 Mesh Analysis II


Mesh Analysis ||

Date : 9/12/17

Overview 

           Use mesh analysis to analysis the circuit. Find V1  and I1. 

Pre-lab 

1) Predict I1 

loop I0 
        -3 + 20k (I0) + 4.7k (I0 - I1) = 0
        24.7k (I0) - 4.7k (I1) = 3

loop I1
        4.7k (I1 - I0) + 10k (I1) + 6.8k (I1 - I2) = 0
        -4.7k (I0)  +21.5k (I1) - 6.8k (I2) = 0

loop I2 
         6.8k (I2 - I1) + 5 = 0
         -6.8k ( I1) + 6.8k (I2) = -5

Matrix of Loop I0, I1, I2


I0 =  60.4 μA
I1 = -321 μA
I2 = -1056 μA

2) Predict V1

V1 = -321μA (6800) - (-1056μA) (6800)
V1 = 4.998  volts
V1 = 5 volts

Also, the voltage source of 5 volts into parallel resistors is the same for each resistor, meaning 5 volts goes through each resistor, resulting in 5 volts for V1  which also matches our calculated value. 


Lab 


V1 = 5.19 volts 


Percentage error between calculated and actual for V1
            ((5.19 - 5.0) / (5.0)) * 100  = % 3.8 error

Comments 

Noted that the Voltage source was at 5.2 volts instead of 5 volts which resulted in percentage error. Also, our recorded 5.19 volts matches the voltage source of 5.2 volts, where 5.2 volts is rounded up to 5.2 on the Power Source.
 
Below is the circuit created in the Every Circuit App. Our calculated value of -321 matches the simulated value shown below, with the negative indicating counter clockwise from our original clockwise direction.


EveryCircuitApp
TinkerCadApp

Thursday, September 7, 2017

9/7/17 Mesh Analysis I

Mesh Analysis | 

Date 9/7/17

Overview 
        Use mesh analysis to analysis the circuit in the figure below.
Pre-lab 
          Using the mesh analysis technique, find V1 and V2. 


V1 = 2.42 volts 

V2 = 4.44 volts 

Percentage error for V1 
                 ((2.42-2.35) / (2.35))*100 = % 2.98 error for V1 

Percentage error for V2 
                 ((4.44-4.36) / (4.36))*100 = % 2.07 error for V2 

Comments  
            Originally, despite having a slight understanding of breadboards, our calculated values were not matching our actual values because we had connected the ground node incorrectly. 
            After going home and simulating the same circuit on TinkerCad, I realized not only my mistake found in the ground node based on the photo I took, but was able to reconstruct correctly a simulated circuit using TinkerCad, resulting in fixing this error and having a small percentage error between our calculated and actual readings for V1 and V2. 


TinkerCadApp 


EveryCircuitApp


Tuesday, September 5, 2017

9/5/17 Nodal Analysis I

Nodal Analysis |

Date: 9/5/17

Overview

To analyze a circuit using nodal analysis. 


Pre-lab 

Use nodal analysis to calculate V1  and V2  in the circuit. 


V1 = 4.44 volts 


V2 = 2.42 volts 


Thursday, August 31, 2017

8/31/17 Dependent Sources and MOSFETs

Dependent Sources and MOSFETs
Date 8/31/17

Overview 

Gain an understanding of transistors by using variable voltage inputs to see how a MOSFETs (Metal Oxide Semiconductor Field Effect Transistors) works. MOSFET'S come in n-channel and p-channel, we will be using a ZVN2210A n-channel MOSFET. The three terminals of the device are called the source (S), the drain (D) and the gate (G).


Lab Procedures:
Circuit Diagram from Lab Procedure

1) Make a circuit as shown in the figure below. Connect variable voltage source and a volt meter to the G terminal of the MOSFET, with the d terminal toward the 100 resistor. and s terminal toward ground node.

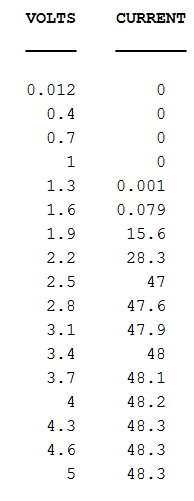
2) Starting from 0 volts, apply voltage until there's a current reading in the second Digital Multimeter which is set up in Amps. Record value when current records a value and increase in intervals of 0.3 volts and run intervals up to 5 volts. 

3) Plot data

4)  Using slope from data, estimate value g. 

RESULTS : 

MOSFET CIRCUIT

Data table of Data collected

\

Graph of Data


Slope of data 

Value of g = 51(mA/V) based on slope from graph above 

This lab we did within our first 2 weeks of class. My group was unsuccessful and I decided to re-due this lab correctly from home. I tried looking for this Mosfet at a electronic store with no luck, and later realized Mosfets are the same as a transistor with the same n-channel and p-channel types. My personal voltmeter gave zeros when I tried redoing this lab and only got 0's for current at all voltage levels, when I realized my Amp meter within my DMM is not working. 

This lab, once done correctly was cool to see how transistors require a certain amount of energy to work and caps out within a range specific to each transistor. 

Tuesday, August 29, 2017

8/29/17 Solderless Breadboards, Open-Circuit & Short-Circuit

Solderless Breadboards, Open-Circuits and Short-Circuits 

Date: 8/29/17 

Overview 

This lab will give an understanding of breadboards and measuring resistance using a Digital Multi Meter (DMM). 

Lab Procedure 

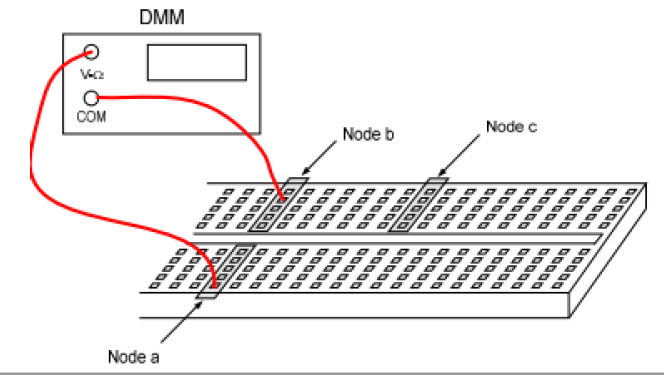
1) Use a DMM in two holes in the same row on the beard board and record resistance as in the figure. 
2) Check resistance of two separate rows using the DMM. Record results. 

3) Check two different rows of breadboard between Node A and Node C. Record results 

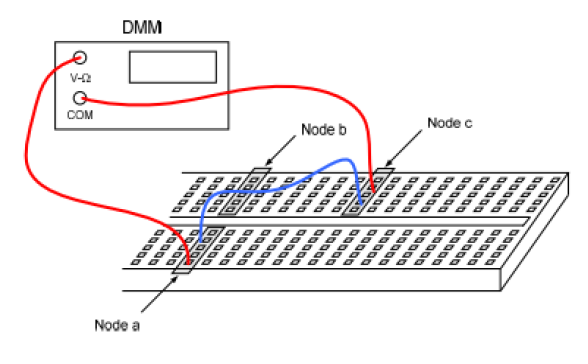
4) Use a jumper wire (simply a wire) to connect two different nodes, use DMM at each node. Record Results. 
Observation 

1) Lab procedure 1 is the result of a short circuit resulting in a low DMM reading of 0.4 Ω.

2) Lab procedure 2 is an open circuit resulting in a very high or infinite DMM reading of " 1 " meaning infinite value. When turning the "Ω." dial from 200Ω to 2000kΩ, reading continues to be "1", an open circuit. 

3) Lab procedure 3 resulted in the same results of lab procedure 2, resulting in a open circuit with a DMM reading of "1."


4) Lab procedure 4 resulted in the same results as lab procedure 1, resulting in a closed circuit with a reading of 0.5 Ω.